Page History
...
NUTS classification – regions are classified according to the Nomenclature of Units for Territorial Statistics (NUTS). The NUTS serves as a reference for the collection, development and harmonisation of EU regional statistics and for socio-economic analyses of the regions (more information is available on Eurostat's website: http://ec.europa.eu/eurostat/web/nuts/overview).
Software used
In order to allow reproducibility, open-sources statistical software was used for all analyses, namely R (utilising RStudio).
The script files used are available for download at XXX. The scripts are written in a way that should allow any user to run them and recreate the same maps. If a user is new to R, then each library referenced at the start of each script will need to be installed (only once). E.g.
...
Applying Straight Lines to the Real Network
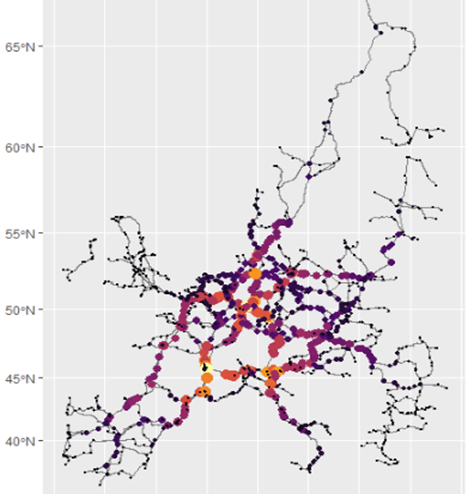
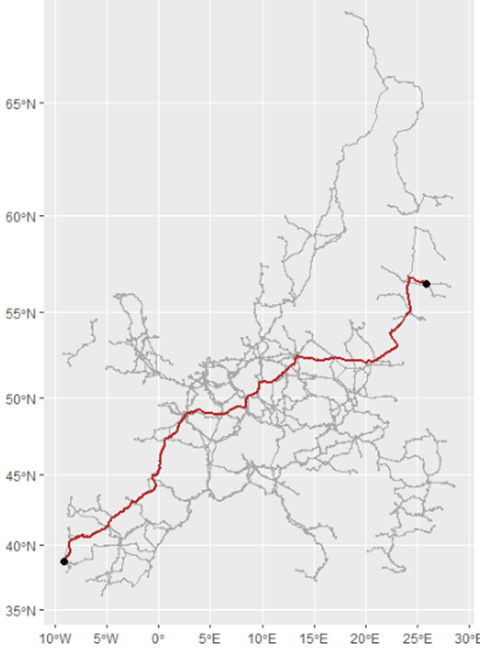
In the origin-destination visualisations above, connecting lines are based on the centroids of the origin and destination regions. At the aggregate level this provides a reasonable level of accuracy for the visualisation, but it would obviously be better if the route fitted the real pattern of the network instead. How can this be done?
The first step is to obtain the relevant network Shapefiles. Through its various infrastructure agreements, UNECE has Shapefiles for the AGN (inland waterways) and AGR (road) agreements. Shapefiles for the AGC (railways) agreement are not yet available, but the TEN-T core rail network files are available and this closely agrees with
Country Examples
Overview
Content Tools
Apps