Page History
...
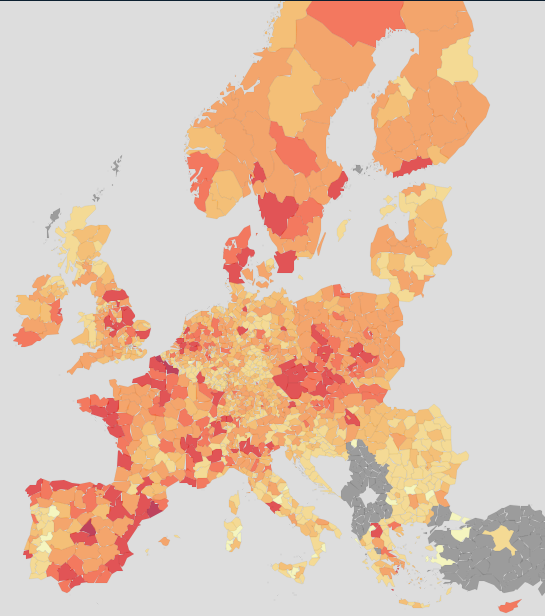
Data availability is essentially complete for EU and EFTA countries. The below map shows region of loading, coloured by loaded quantity. The interpretation of the visualisation is somewhat complex; while on the one hand the darker areas represent areas with more goods loaded and therefore more commerce and industry, there are also highly industrialised areas (e.g. along the Rhine) with low values due to the favorising of inland water transport and rail.

Road passengers
Unfortunately no regional road passenger data are currently collected.
Road vehicle fleet
Road accidents
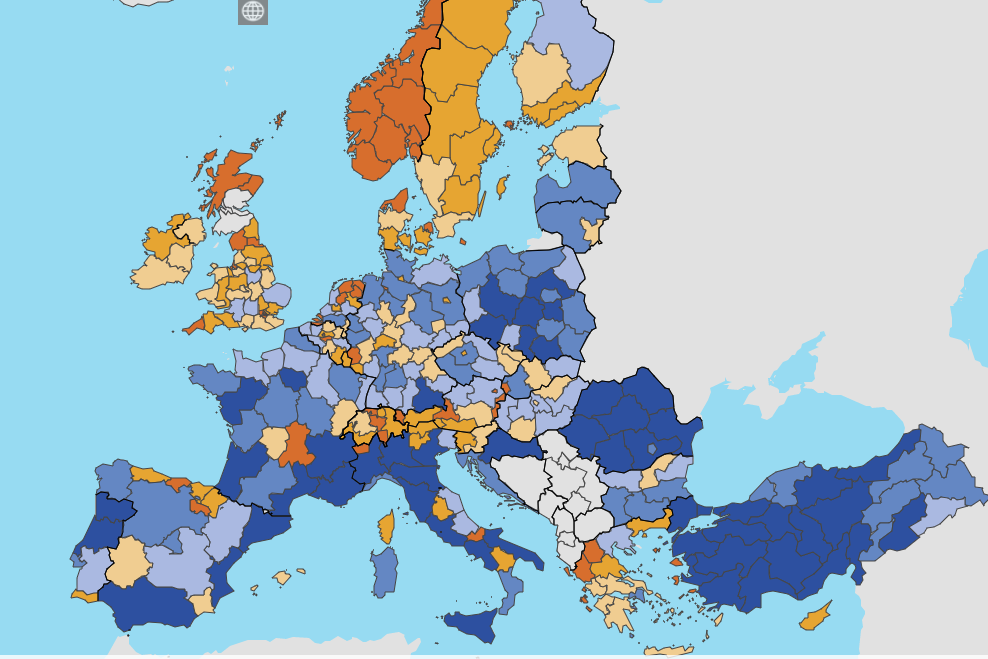
Road accidents per million inhabitants by region can be plotted in a similar way. There is an important disclaimer to note, which is that this will likely overrepresent the road danger in some sparsely populsted regions that have principal roads passing through them.
Modal Splits for Specific Corridors
...
Overview
Content Tools
Apps