Page History
...
Considering geospatial factors is becoming increasingly prominent in many statistical domains. Given the nature of transport statistics, being able to identify and visualize the movement of goods and passengers between different regions is of particular relevance. This page shares a few examples of existing sources for these data at the international level, principally UNECE censuses and Eurostat regional data, and techniques for visualising them. Transport statisticians with relevant examples from national statistics offices or other sources are invited to contact the secretariat.
Background and Resources
NUTS classification – regions are classified according to the Nomenclature of Units for Territorial Statistics (NUTS). The NUTS serves as a reference for the collection, development and harmonisation of EU regional statistics and for socio-economic analyses of the regions (more information is available on Eurostat's website: http://ec.europa.eu/eurostat/web/nuts/overview).
...
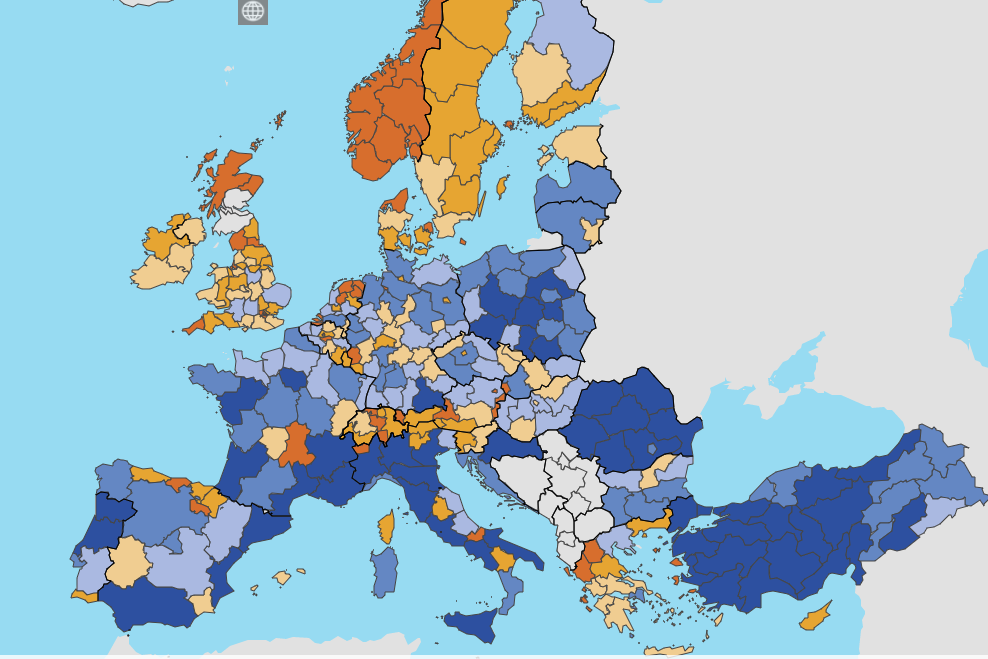
The number of passenger cars per thousand inhabitants is an interesting indicator of how much cars are used in different regions compared to public transport, although it is also is related to income as well. These data can be visualised on the Eurostat website directly here https://ec.europa.eu/eurostat/databrowser/view/TRAN_R_VEHST__custom_250445/default/map?lang=en.
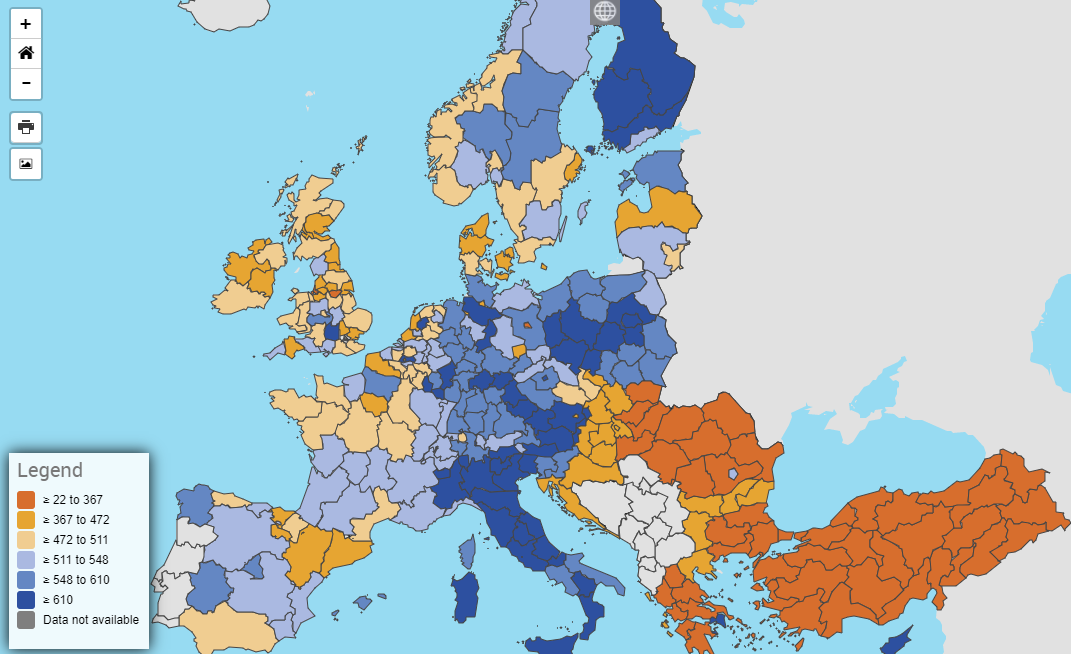
Road accidents per million inhabitants by region can be plotted in a similar way. There is an important disclaimer to note, which is that this will likely overrepresent the road danger in some sparsely populated regions that have principal roads passing through them. The below image is sourced directly from Eurostat's data browser https://ec.europa.eu/eurostat/databrowser/view/tran_r_acci/default/table?lang=en.
...
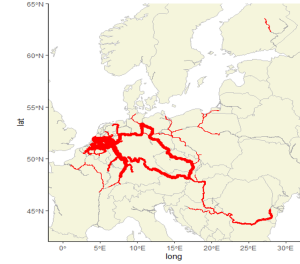
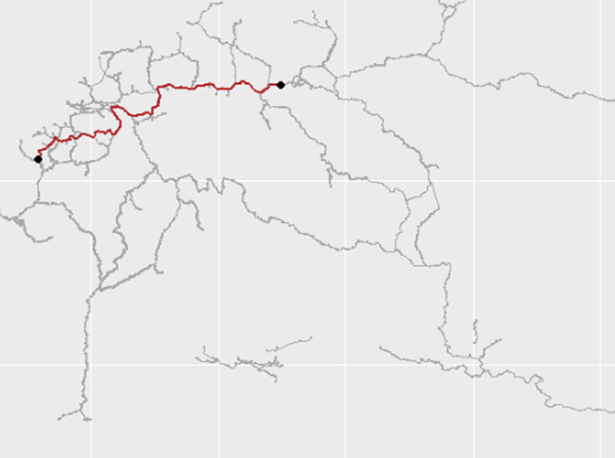
The same is done for the AGN (inland water) network below, between Rotterdam and Poland.
Collating Multiple Journeys
...
THe final step in the process was to collate all individual paths. FOr this the overline function of the StPlanR package in R can be used. THis gives the following result for the inland waterway network in 2019. The code for this can be found at https://github.com/blackburnstat/Mapping_IWW_tonnage.

Modal Split Analysis for Specific Corridors
...
Overview
Content Tools
Apps