Page History
...
There are national-level international rail journey datsets datasets available, but this regional dataset has the benefit of collecting information from both the origin and destination country, which means that less data are unavailable due to confidentiality (as long as one country publishes the figures, then they are visible). Data can thus be visualised, but given the large number of connections with very small numbers of passengers, some filtering makes sense. The picture below shows a map with all flows greater than 100,000 passengers a year. The map shows, for example, interesting difference sin traffic between France, where most flows connect with Paris, and Germany, where the flows are much more spread out between multiple large cities.
...
NST2007 has too many categories to easily visualize, but it is possible to combine a few different categories. The below above (right) map compares three broad good types: "Agri" contains, agricultural products, forestry products and food; "Fuel" contains primary and secondary fossil fuels; and "Metal" contains primary and secondary metallic products, as well as chemicals. This map is available at https://rpubs.com/BlackburnStat/690030.
(see also Collating multiple journeys below).
Road
Road freight
In contrast to the rail and inland water data, there are no published origin-destination linked data for road freight. Two similar datasets give freight performance by either region of loading (road_go_ta_rl) and region of unloading (road_go_ta_ru), respectively.
...
Unfortunately no regional road passenger data are currently collecteddisseminated.
The number of passenger cars per thousand inhabitants is an interesting indicator of how much cars are used in different regions compared to public transport, although it is also is related to income as well. These data can be visualised on the Eurostat website directly here https://ec.europa.eu/eurostat/databrowser/view/TRAN_R_VEHST__custom_250445/default/map?lang=en.
...
Collating Multiple Journeys
...
The final step in the process was to collate all individual paths.
...
For this the overline function of the StPlanR package in R can be used.
...
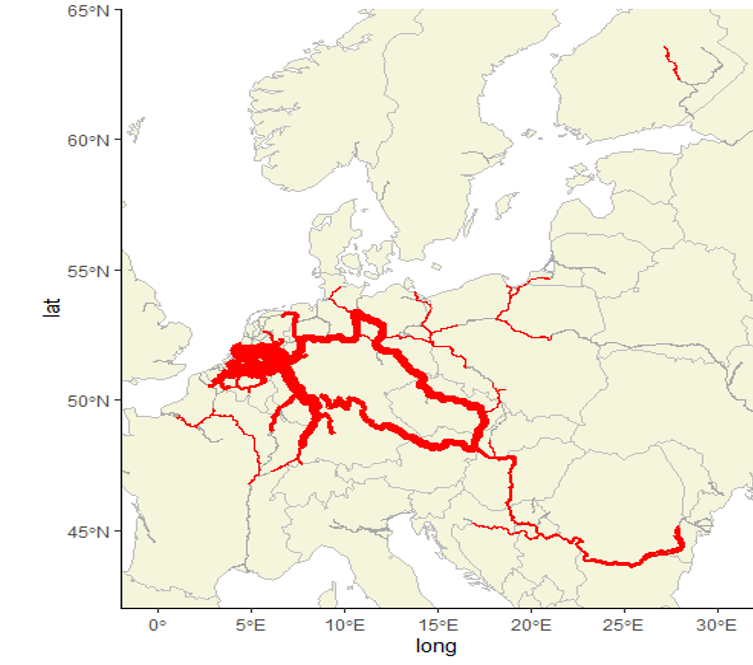
This gives the following result for the inland waterway network in 2019. The code for this can be found at https://github.com/blackburnstat/Mapping_IWW_tonnage.
Modal Split Analysis for Specific Corridors
Combining the data for multiple modes is would be a logical next step in this analysis. This would allow modal split calculations to be done for specific corridors (like in the picture below), allowing identification of modal shifting opportunities to less polluting and safer modes for both passenger and freight transport.
...
Overview
Content Tools
Apps