Page History
...
Considering geospatial factors is becoming increasingly prominent in many statistical domains. Given the nature of transport statistics, being able to identify and visualize the movement of goods and passengers people between different sub-national regions is of particular relevance. This page shares a few examples of existing sources for these data at the international level, principally UNECE censuses and Eurostat regional data, and techniques for visualising them. Transport statisticians with relevant examples from national statistics offices or other sources are invited to who wish to collaborate on this at future meetings of the Working Party on Transport Statistics are invited contact the secretariat.

Background and Resources
E-Roads of the AGR Network – E-Roads are defined in the 1975 European Agreement on Main International Traffic Arteries (AGR). https://unece.org/DAM/trans/doc/2016/sc1/ECE-TRANS-SC1-2016-03-Rev1e.pdf.
E-Rail lines of the AGC Network – E-Rail lines are defined in the European Agreement on Main International Railway Lines of 1985 (AGC), https://unece.org/DAM/trans/doc/2019/sc2/ECE-TRANS-63-Rev.4e.pdf.
E-Inland Waterways of the AGN Network –
NUTS classification – regions are classified according to the Nomenclature of Units for Territorial Statistics (NUTS). The NUTS serves as a reference for the collection, development and harmonisation of EU regional statistics and for socio-economic analyses of the regions (more information is available on Eurostat's website: http://ec.europa.eu/eurostat/web/nuts/overview). Several Eurostat datasets are based on movements between NUTS2 regions.
Software used
In order to allow reproducibility, open-sources statistical software was used for all analyses, namely R (utilising RStudio).
The script files used for production of any maps below are either linked to below or are available on request. The scripts are written in a way that should allow any user to run them and recreate the same maps. If a user is new to R, then each library referenced at the start of each script will need to be installed (only once). E.g.
Installinstall.Packages("tidyverse").
UNECE E-Road and E-Rail Censuses
...
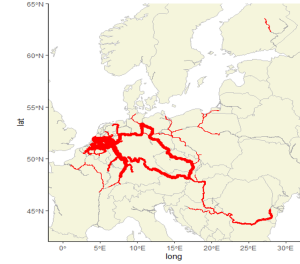
The UNECE E-Road Census collects traffic volumes on principal road arteries of international importance. Data are only collected every five years. Data for 20252020, 2015 2010 and 2005 can be explored here https://www.unece.org/trans/main/wp6/e-roads_maps.html. Unfortunately only a limited number of UNECE countries provide data in a geospatial format that allows this visualization. Some countries do have traffic counts at specific points and the secretariat is exploring ways to help countries produce similar outputs with these traffic counts as inputs.
E-Rail Census
...
Overview
Content Tools
Apps