Page History
...
This map can be viewed interactively at https://rpubs.com/BlackburnStat/689644.
Rail Goods
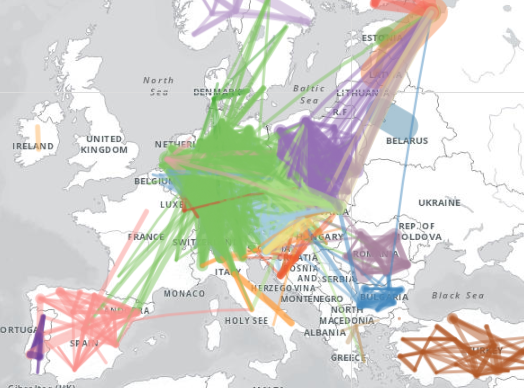
On the freight side, a similar dataset is collected between origin and destination NUTS2 regions, named tran_r_rago. Again, this dataset is asked for only every five years.
![]()
These data can be similarly processed and be used to create a map of rail freight. This map can be browsed at https://rpubs.com/BlackburnStat/690015
Inland Water Freight
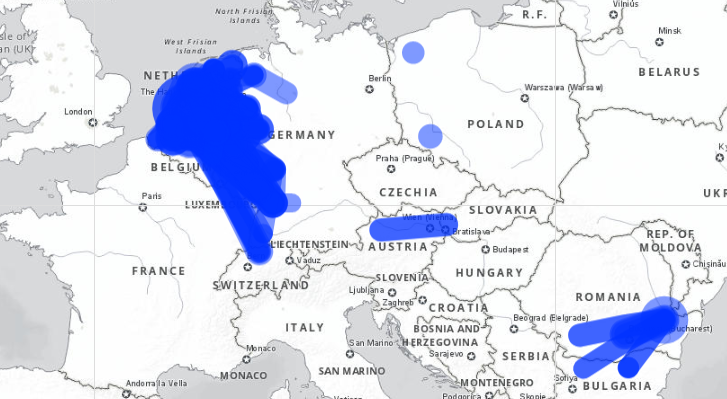
The iww_go_atygofl dataset contains similar data to the rail freight numbers, but has the added benefit of breaking data down by type of good according to the NST2007 classification.
![]()
The screenshot below shows all flows above 500,000 tonnes in 2018 (unlike the rail data, the inland water data are collected annually). View this map at https://rpubs.com/BlackburnStat/690029.
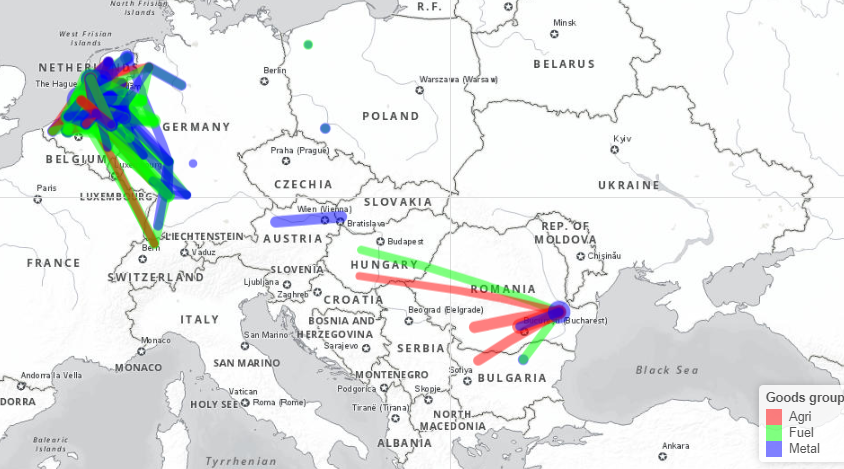
NST2007 has too many categories to easily visualize, but it is possible to combine a few different categories. The below map compares three broad good types: "Agri" contains, agricultural products, forestry products and food; "Fuel" contains primary and secondary fossil fuels; and "Metal" contains primary and secondary metallic products, as well as chemicals. This map is available at https://rpubs.com/BlackburnStat/690030.
Road
Road accidents
Modal Splits for Specific Corridors
...
Overview
Content Tools
Apps