Introduction
Considering geospatial factors is becoming increasingly prominent in many statistical domains. Given the nature of transport statistics, concerning the movement of goods and passengers between different regions is of particular relevance. This page shares a few examples of existing sources for these data at the international level.
Background and Resources
NUTS classification – regions are classified according to the Nomenclature of Units for Territorial Statistics (NUTS). The NUTS serves as a reference for the collection, development and harmonisation of EU regional statistics and for socio-economic analyses of the regions (more information is available on Eurostat's website: http://ec.europa.eu/eurostat/web/nuts/overview).
Software used
In order to allow reproducibility, open-sources statistical software was used for all analyses, namely R (utilising RStudio).
The script files used are available for download at XXX. The scripts are written in a way that should allow any user to run them and recreate the same maps. If a user is new to R, then each library referenced at the start of each script will need to be installed (only once). E.g.
Install.Packages("tidyverse").UNECE E-Road and E-Rail Censuses
E-Road Census
The UNECE E-Road Census collects traffic volumes on principal road arteries of international importance. Data are only collected every five years. Data for 2025, 2010 and 2005 can be explored here https://www.unece.org/trans/main/wp6/e-roads_maps.html.
E-Rail Census
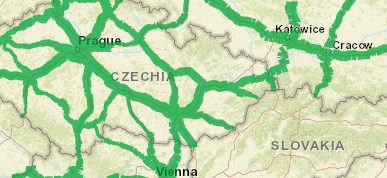
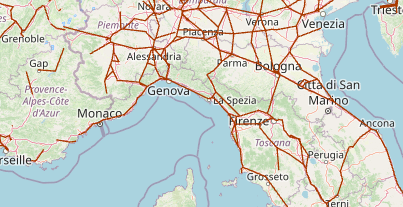
The UNECE E-Rail census collects data on principal rail routes, as defined by the AGC, in a similar fashion to the E-Road census. Rail traffic has the advantage of the split between passenger and freight trains is normally easy to make, therefore traffic for either the movement of people or goods can be visualised separately.
Due to the way the data are collected, Shapefiles that model the real shape of the network are typically not available, but origin-destination lines can be created. Depending on how well segmented the data are, these can often fit the realities of the country's geography quite well. Explore the data here https://www.unece.org/trans/areas-of-work/transport-statistics/statistics-and-data-online/e-rail-census/traffic-census-map.html.
Eurostat Regional (NUTS 2 and NUTS 3) Data for Road, Rail and Inland Water
In addition to the census data collected directly by UNECE, Eurostat collects many different regional datasets that can be visualised, some of which are on an annual basis. While the UNECE censuses collect traffic volumes, i.e. number of vehicles per day, the Eurostat data focus on transport measurement, that is passenger numbers and passenger-km, tonnes and tonne-km. Examples of possible visualisations are
Rail Passengers
There is only one Eurostat passenger rail dataset that contains data below the national level. The "tran_r_rapa" set covers both national and international railway passengers transported by loading and unloading NUTS 2 region.
![]()
There are national-level international rail journey datsets available, but this regional dataset has the benefit of collecting information from both the origin and destination country, which means that less data are unavailable due to confidentiality (as long as one country publishes the figures, then they are visible). Data can thus be visualised, but given the large number of connections with very small numbers of passengers, some filtering makes sense. The picture below shows a map with all flows greater than 100,000 passengers a year. The map shows, for example, interesting difference sin traffic between France, where most flows connect with Paris, and Germany, where the flows are much more spread out between multiple large cities.
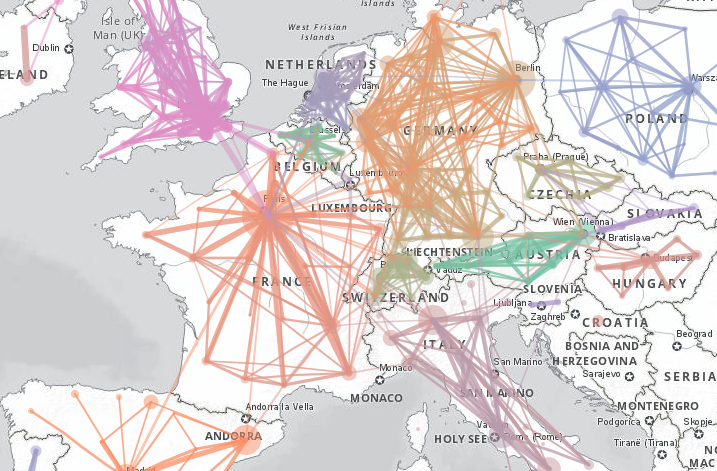
This map can be browsed in an interactive format at https://rpubs.com/BlackburnStat/689627.
As mentioned, just the international journeys can be filtered out if desired. The following figure shows all international rail passenger journeys 9from the dataset) greater than 50,000 passengers a year. This map shows, for example, the prominence of Paris and Vienna as international rail hubs, and also shows that the top five origin-destinatino combinations are:
- Malmo-Copenhagen
- Flokestone-Calais (Eurotunnel)
- London-Paris (Eurostar)
- Stuttgart-Geneva&Lausanne
- Paris-Brussels
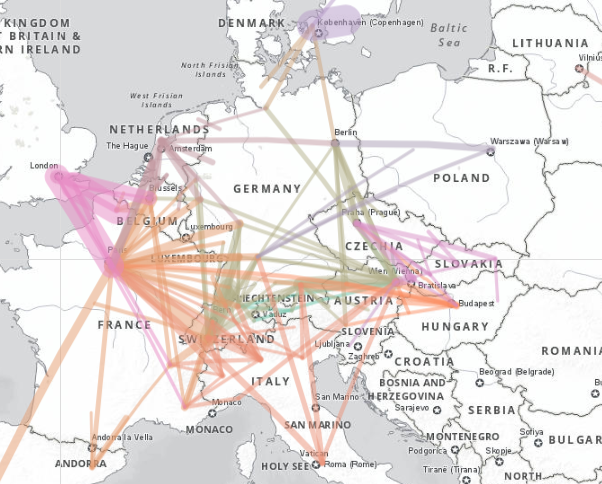
This map can be viewed interactively at https://rpubs.com/BlackburnStat/689644.
Rail Goods
Inland Water
Road
Road accidents
Modal Splits for Specific Corridors
Applying Straight Lines to the Real Network
Data in North America
Country Examples
Overview
Content Tools
Apps