For their November Road Safety Week, the Israeli Central Bureau of Statistics released new 2020 year-to-date data on road safety performance, with comparisons with the same time period of 2019. While the provisional data showed a strong decrease in the number of accidents (20.1%) and the number of total casualties (26.5%), the number of fatalities only decreased by 4.5%. Explore the press release and data tables here https://www.cbs.gov.il/en/mediarelease/Pages/2020/Selected-Data-for-Road-Safety-Week-in-November.aspx.
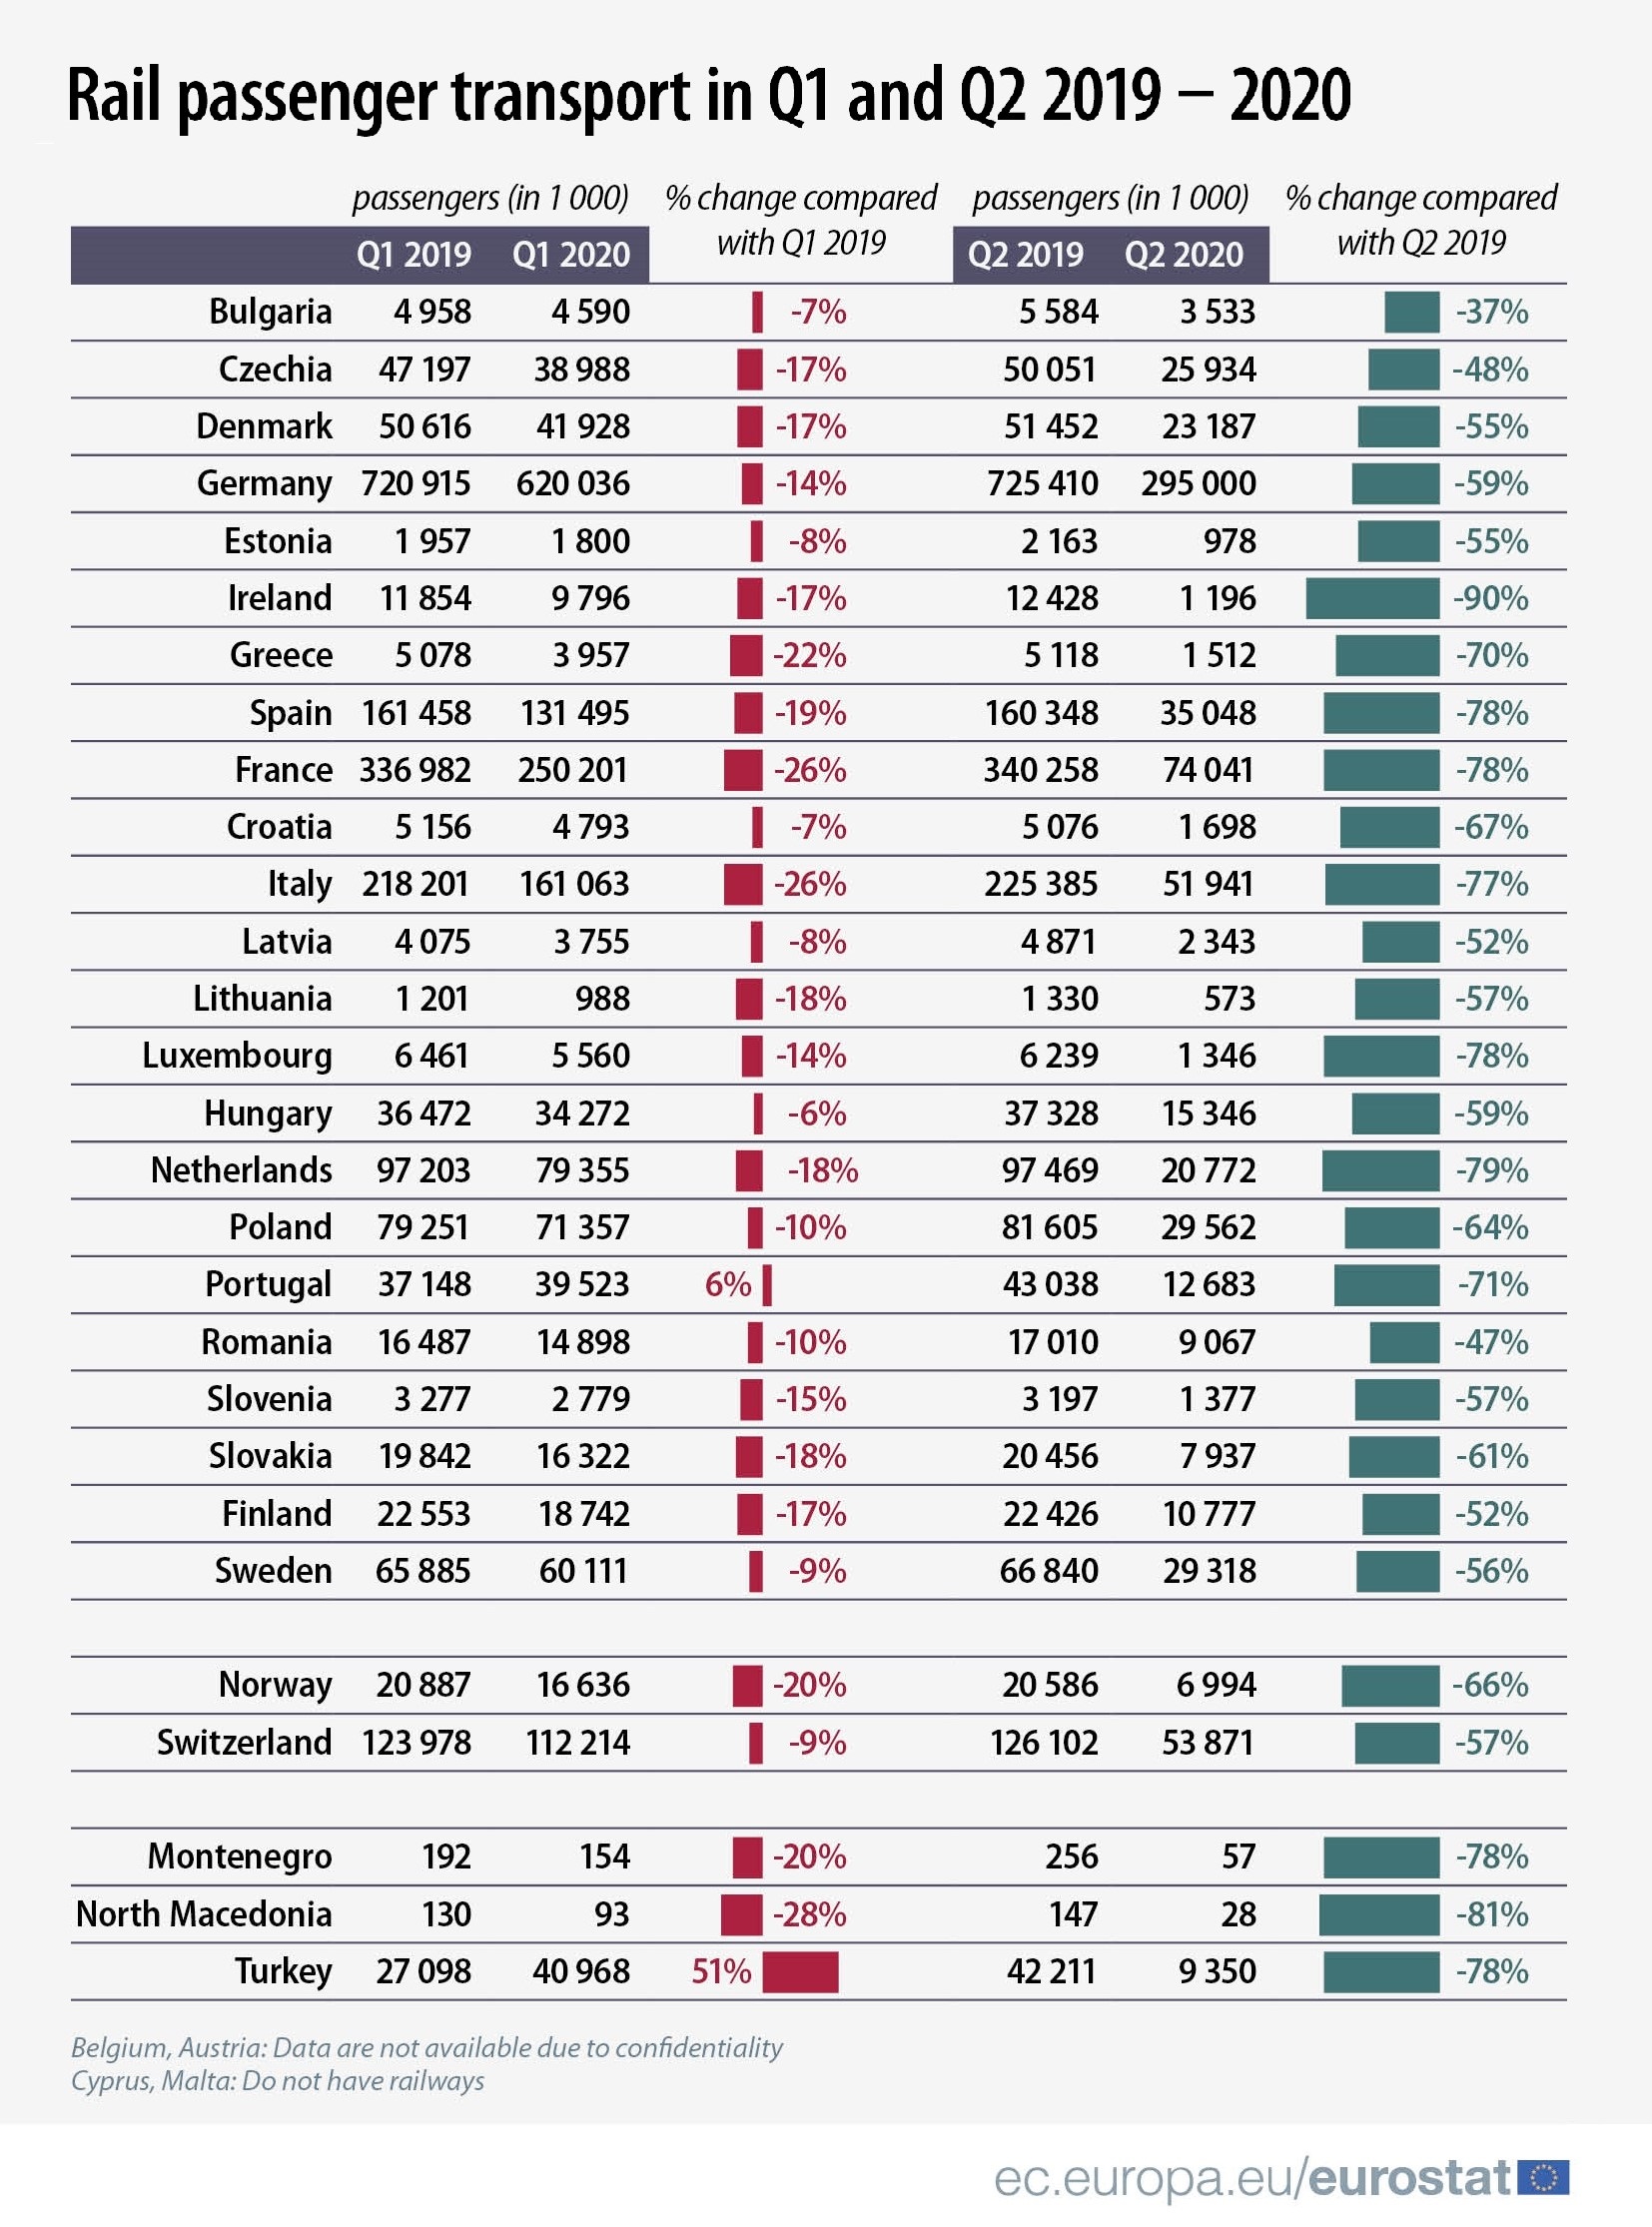
Eurostat have published data from most EU and EFTA countries on quarterly rail passenger statistics. As expected the 2Q2020 figures show dramatic drops for virtually every country.
The link is here https://ec.europa.eu/eurostat/web/products-eurostat-news/-/DDN-20201105-1.
Overview
With more data now available since the previous blog post, further road safety impacts of COVID19 can be seen in different countries (or in some cases, cities) with data available. Given each country has responded differently to COVID19 and at different timescales, no overall patterns can be observed. However, there have been drastic reductions in road fatalities in many countries.
The limited data availability hereafter also highlights that countries and cities reporting timely road traffic accident information (i.e. provisional monthly data one or two months after the reference month) are very much the exception. Dozens of UNECE countries, covering hundreds of millions of people, do not publish any timely road safety data. COVID19 has highlighted that annual data are not sufficient for monitoring events in real time. There are some interesting examples of countries responding to this challenge by publishing transport statistics quicker than usual, prioritizing timeliness over typical verification techniques, and countries may wish to explore this strategy for monitoring road safety in the weeks and months to come. This is particularly pressing given the wide range of pedestrian and cycling infrastructure improvements being implemented in many cities.
France
With lockdown only starting on 17th March, April was the first full calendar month that any road safety impact could be fully present in France. And indeed the traffic fatality reduction was striking, with a 56% year-on-year drop in fatalities in France (Metropolitan), and even a 33% drop compared to March 2020's low figure . It is likely (with official traffic data not available), however, that traffic volumes decreased by an even greater amount than this. And so this positive cut in road fatalities needs to be seen in the context of a large decrease in exposure (measured in vehicle-km or passenger-km).

Figure 1: Monthly road traffic accident fatalities in Metropolitan France, 2019 and 2020. Source
Ireland
There were seven fatalities in April 2020 in Ireland. This number is below average compared to April in previous years, but not close to any historical lows. It is however, the lowest monthly fatality number since May 2018.
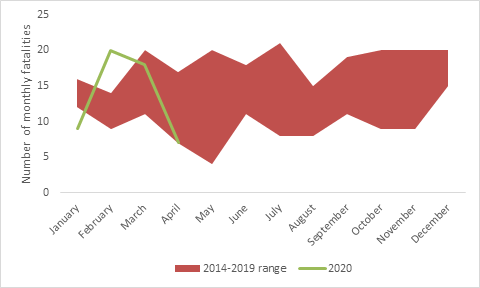
Figure 2: Monthly road traffic accident fatalities in Ireland, 2020 compared with the 2014-2019 range. Source
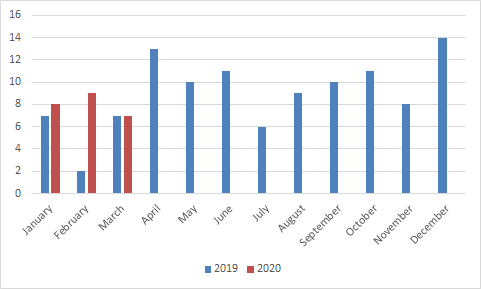
Israel
18 road fatalities occurred in March on Israel’s roads, the lowest figure since September 2018. As can be seen from the graph, each month of 2020 has so far been safer than the same months in 2017-2019.
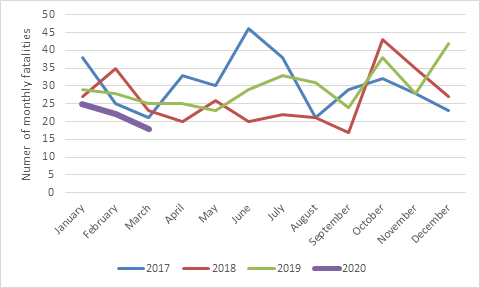
Figure 3: Monthly road traffic accident fatalities in Israel, 2020 compared with 2017-2019. Source
Norway
Six fatalities occurred on the roads of Norway in April 2020. This is a reduction of two compared to March 2020, and a 54% reduction on April 2019.
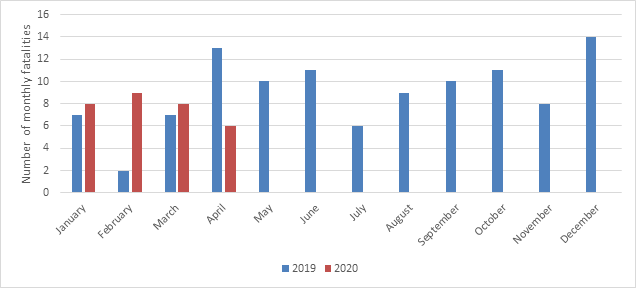
Figure 4: Monthly road traffic accident fatalities in Norway, 2020 compared with 2019. Source
Sweden
Data for Sweden in April show 17 fatalities in the calendar month, which is completely in line with the April data for the three previous years. It is important to note that Sweden implemented much less strident restrictions in movement than other countries.
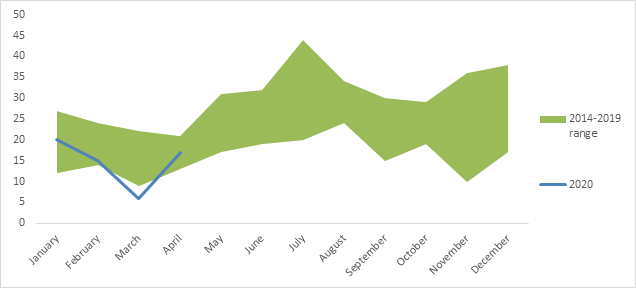
Figure 5: Monthly road traffic accident fatalities in Sweden, 2020 compared with the 2014-2019 range. Source
London, United Kingdom
Nine people lost their lives on Greater London roads in April 2020, a 36% decrease on both March 2020 and April 2019 numbers. Longer time series comparisons are more difficult to make due to differences in methodology between the provisional and the finalised historical data.
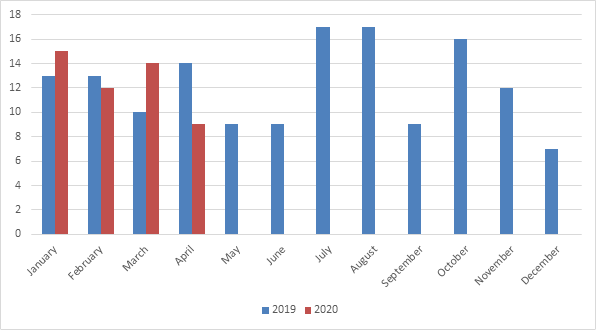
Figure 6: Monthly road traffic accident fatalities in Greater London, 2020 compared with 2019. Source
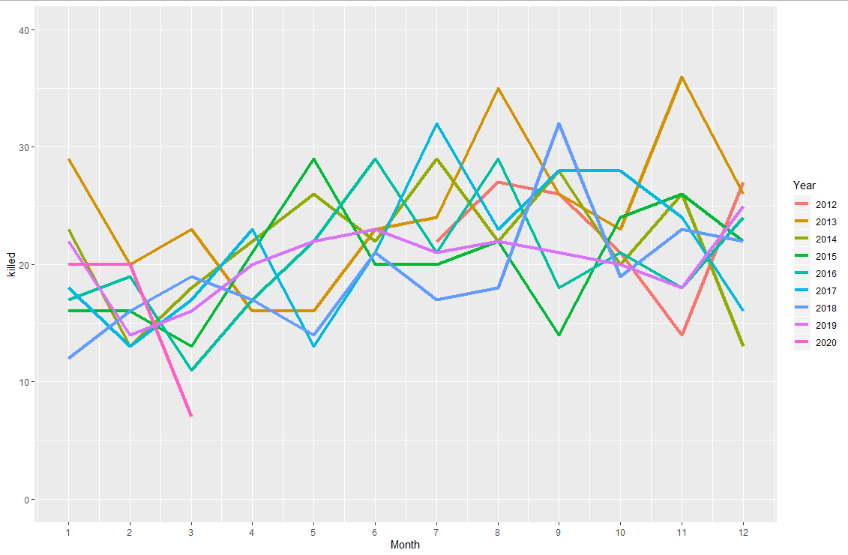
United States of America
The National Safety Council has published monthly estimates of road traffic fatalities, by state, up to March 2020. These data have been combined with vehicle miles travelled to show that, despite March 2020 seeing 5.4% less fatalities than March 2019, this is actually a 14% increase in terms of fatalities per vehicle mile.
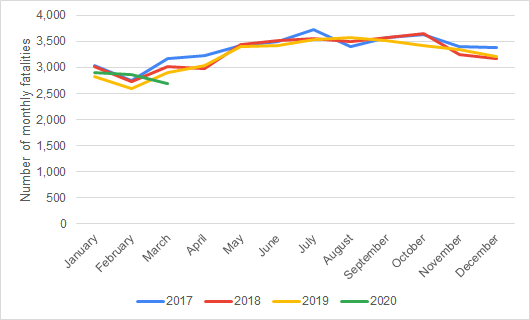
Figure 7: provisional onthly road traffic accident fatalities in United States, by year. Source
New York City, United States of America
Data for New York City (recorded by the NYPD) showed 13 deaths in April. While this is not a historically low number (March 2016 saw 11 fatalities for example), when considering seasonality it is the lowest April value going back to at least 2013 (and likely much earlier).

Figure 8: Monthly road traffic accident fatalities in New York City, 2020 compared with the 2014-2019 range. Source
San Francisco, United States of America
Another United States city that has timely road accident data is San Francisco. Data are available for each month of 2020, and also a five-year average for 2015-2019 is given for each month (hence why non-integer values appear on the below graph).

Figure 9: Monthly road traffic accident fatalities in San Francisco, 2020 compared with the 2015-2019 average. Source
Restrictions put in place due to the Coronavirus pandemic have changed the way we live, shop, spend our free time, and the way we move. In many cities, streets have cleared of usual traffic. Public transport has been reduced and the bus, tram and train lines that still operate are used by only a handful of people. The big question is what will happen once the crisis is over. Will traffic return to normal, or could the pandemic spark a lasting change in urban mobility?
Traffic down, cycling up
The chart below shows how traffic levels in New York county (Manhattan) plunged shortly after a local state of emergency was declared in New York City. On 13 March, vehicle miles travelled still reached almost 50 million, but within a week they dropped to less than 10 million, following the adoption of restrictions on schools, businesses and mobility.
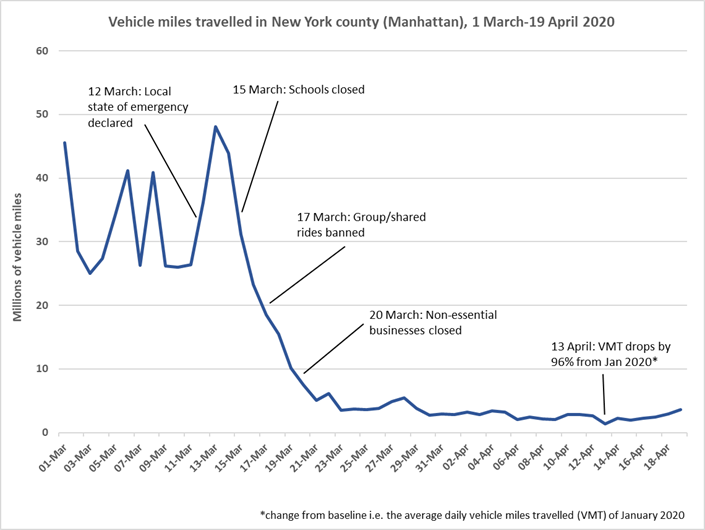
Source: Streetlight Data VMT Monitor
An obvious explanation to the drop in vehicle miles is that people simply stayed at home. As social distancing was encouraged and schools and businesses closed, the need to move from place to place was no longer there. However, the New York City Department of Transportation reports that during March and after encouragement from the Mayor of New York City to avoid crowded public transport, there has been a significant, 50 per cent, increase in cycling.
Many European cities are seeing similar effects and are putting in place measures to make cycling in cities safer and easier. In Berlin, where road traffic has fallen by 40 per cent, bike lanes have been widened and extended to increase safety and give more space to cyclists and pedestrians.
The city of Budapest reports that due to the pandemic the number of passengers on city buses has fallen by 90 percent while vehicle traffic is down by 50 per cent. People are looking for alternative ways of moving from place to place and cycling has emerged as an attractive option. Budapest is increasing the number of bike lanes and the city has also decreased the rental price of citybikes. While these measures currently are temporary, depending on their success, they can become permanent in the future.
Source: GOV.uk
Plans for the future
In some cities, the pandemic situation has eased to the extent that it is possible to start planning for return to normal life. But normal doesn’t need to mean the same as before. Brussels has put forward plans to prioritize cyclists and pedestrians in the city centre. This is to make it easier for people to move while still maintaining a level of social distancing. The plan includes reducing vehicle speed limits to 20km/h and giving pedestrians and cyclists priority to move on streets, not just sidewalks and bike lanes.
The municipality of Milan has proposed an ambitious plan to encourage cycling and walking in the city centre. Milan has been in the epicentre of the Corona crisis in Europe and has had to cut public transport. The municipality doesn’t want to see public transport replaced by private cars, therefore they are heavily investing in sustainable mobility. The plan is to create temporary bike lanes, enlarge sidewalks, and set speed limits for vehicles to 30 km/h. During the summer, Milan plans to transform 35 km of road to better serve cyclists and pedestrians.
For some cities these kinds of measures have been in the plans even before the pandemic hit. For example, New York City has been focusing on the safety of cyclists and building new bike lanes since 2014. Brussels decided last year to reduce vehicle speed limits in the city to 30km/h starting 2021.
Long term impacts?
It will be interesting to see what impacts the pandemic will have on urban mobility in the long run. Cities already on the path to make city centres more pedestrian and biker friendly will most likely continue on their chosen track. If feedback is encouraging, it might push cities that are now putting in place temporary measures to increase the safety of cyclists to make them permanent. The more cities can report positive outcomes, the more likely it is that cycling as the main mode of transport in urban areas will become a major trend.
The Coronavirus pandemic has led countries to restrict the movement of citizens, which can be seen in reduced traffic on most modes of transport. Economic activity has also slowed down as shops and services have been closed. One of the industries hit is the car industry, with demand for new vehicles falling compared to previous years. This is reflected in the number of vehicle registrations, which has dropped considerably.
Data from the European Automobile Manufacturers Association show that the economic impact on the car industry has been significant. In the European Union, new passenger car registrations began to decline at the start of the year, and in March they fell by over 50 per cent year-on-year.
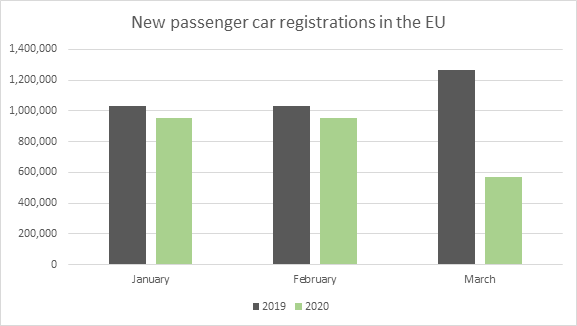
Source: ACEA
Italy
Countries struggling most with the pandemic have seen the largest drops in vehicle registrations. For example, in Italy, during January-March 2020 new car registrations fell by 35 per cent compared to the same period in 2019. In March 2020 alone, vehicle registrations dropped by 85 per cent compared to the previous year.
Switzerland
According to the Federal Statistical Office, vehicle registrations in Switzerland have also been on the decline since the start of the year. In January, new registrations of passenger cars fell by 10 per cent, in February by 14 per cent, and in March the drop was 39 per cent, compared to corresponding months in 2019. Interestingly, March data shows that as registrations of new petrol and diesel cars have almost halved, registrations of hybrid vehicles has actually grown by over 60 per cent.
Germany
In Germany the trend in new vehicle registrations has been similar to that in Switzerland. Vehicle registrations began to decline in January and fell by 37 per cent in March. Comparing the 2020 January-March period to 2019, there have been 20 per cent less vehicle registrations in Germany.
Norway
Similar trends can be seen beyond Central Europe. In Norway, the number of new vehicle registrations fell in March by 33 per cent compared to 2019. However, the decline didn’t start until February. In January, vehicle registrations still increased, although by a very slight 0.3 per cent. Altogether, in January-March 2020 there were 18 per cent less new car registrations compared to the same period in 2019.
Finland
On the other end of the spectrum, in Finland, the number of new passenger cars registered has not yet seen any notable decline. According to Statistics Finland, there was a decline of 0.9 per cent in the number of new passenger cars registered in March. During the period January-March 2020, registrations fell by about 3 per cent compared to the same period in 2019.
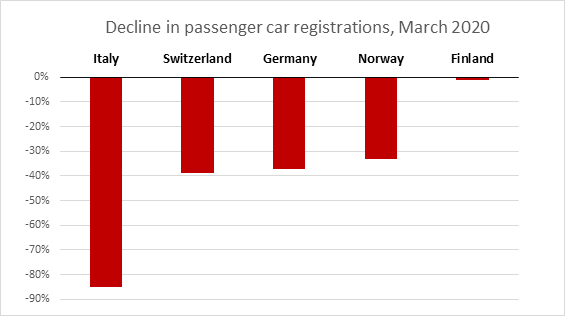
Source: National Statistical Offices or other national agencies and UNECE calculations
Importance of this indicator
The number of new vehicle registrations is less important than e.g. traffic volumes as a measure of how transport activity has changed, but it is very revealing as an indicator of how economic activity is being affected. It is also possible that in the medium term the reduced take-up of new vehicles will have a marginal impact on issues like road safety and air quality, as newer cars are typically safer and cleaner.
Given possibly record reductions in motorised traffic due to various lockdowns caused by the Coronavirus, much interest lies in timely road safety data (even if provisional). As of today, here are a few interesting examples. Each of these is linked to on the main page, and all data should be considered provisional.
France
The French Road Safety Observatory preliminary data show that in March 2020, 154 lost their lives on the roads of Metropolitan France. This is a 39% drop compared to the same period of 2019, and a 29% drop compared to February 2020.
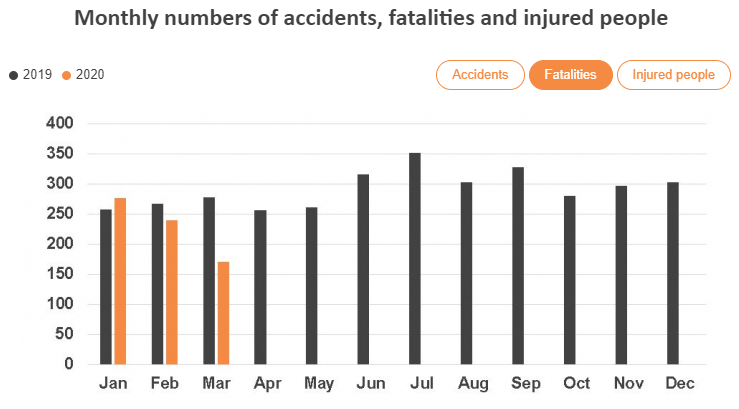
Norway
Provisional data for March 2020 show fatality levels identical to March 2019.
Sweden
In March 2020, 6 people died on the roads in Sweden. This is the lowest figure since monthly data have been published (going back to 2003), and is a 40% reduction on the March 2019 figure.
London, United Kingdom
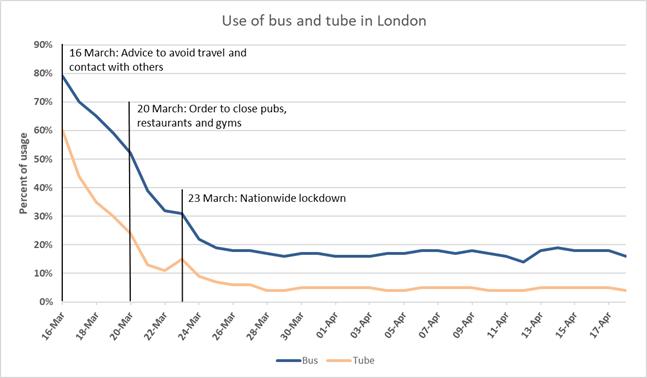
13 people are recorded as road traffic fatalities by Transport for London in March 2020, making 40 fatalities for 1Q2020 in total, which is actually an 11% increase compared to 1Q2019. (The UK was only put into formal lockdown on 23 March).
New York City, United States
Daily traffic crashes reported by the New York Police Department show that in March 2020, seven road traffic fatalities occurred, which is the lowest monthly figure since the series begins in July 2012.
*Data manipulated and graphed in R by UNECE. A basic R-script is available that allows monthly data to be downloaded.
This page will be updated when notable examples of statistics sources that show the Coronavirus impact on transport systems become available.